Earth Science 7-Washington D.C., United States
From SJS Wiki
Contents
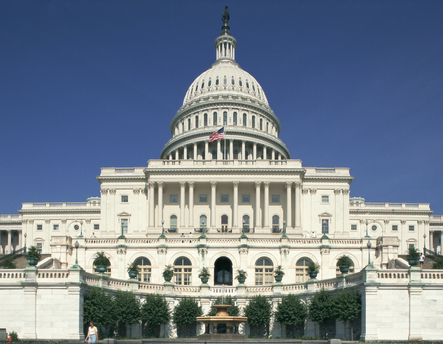
Washington D.C., USA
References

Latitude/Longitude
38.53 N/ 77.02 W
Elevation
0–409 ft (0–125 m)
Major Body of Water
Potomac River


Koppen Classification
Washington, DC is a Cfb on the Koppen Classification System.
Factors that Affect the Climate
Washington DC is near the Atlantic Ocean, so it has less extreme temperatures than inland cities. Also, it is at the 38 degree latitude, so it is near the middle latitudes.
Average Temperature
| Washington DC Temperature | Jan | Feb | Mar | Apr | May | Jun | Jul | Aug | Sep | Oct | Nov | Dec | Annual | ||
| Avg. Temperature | 1.45 | 3.05 | 8.35 | 13.6 | 19.05 | 24.15 | 26.55 | 25.8 | 21.8 | 14.35 | 9.8 | 4.1 | 14.4 | ||
| Avg. Max Temperature | 5.7 | 7.7 | 13.6 | 19.2 | 24.5 | 29.2 | 31.3 | 30.5 | 26.7 | 20.6 | 14.6 | 8.3 | 19.3 | ||
| Avg. Min Temperature | -2.8 | -1.6 | 3.1 | 8.0 | 13.6 | 19.1 | 21.8 | 21.1 | 16.9 | 10.1 | 5.0 | -0.1 | 9.5 | ||
Average Precipitation
| Washington DC Precipitation | Jan | Feb | Mar | Apr | May | Jun | Jul | Aug | Sep | Oct | Nov | Dec | Annual |
| Precipitation (inches) | 2.6 | 3.5 | 2.8 | 3.7 | 3.1 | 3.8 | 4.1 | 3.3 | 3.1 | 3.0 | 3.1 | 3.1
39|- |