Difference between revisions of "Earth Science 7- Asia - Nolan, Andrew, Ben"
(→Elevation to Vegitation) |
(→Elevation and Vegitation) |
||
| Line 511: | Line 511: | ||
http://www.apipnm.org/swlwpnr/reports/y_ta/z_ph/ph_map/phmp211.png | http://www.apipnm.org/swlwpnr/reports/y_ta/z_ph/ph_map/phmp211.png | ||
| + | |||
| + | <ref>http://www.apipnm.org/swlwpnr/reports/y_ta/z_ph/ph_map/phmp211.png</ref> | ||
===Topography to high and low pressure zones=== | ===Topography to high and low pressure zones=== | ||
Revision as of 22:20, 4 December 2011
Contents
Russia
Location
Russia is located at 60 00 N, 100 00 E, and it is one of the few countries which can be defined as being in the continents of Europe and Asia. It is bordering the countries of Mongolia and Kazakhstan. [1]
Elevation Extremes
Russia’s elevation points are as follows: lowest point of elevation is the Caspian Sea at 28 m and the highest point is Gora El’brus at 5,633 m. [1]
Geography
Russia’s terrain is hilly and plain-like. Russia is also the largest country in the world, if measured by area. Also, the highest point of elevation, Mt. El’brus is the highest peak in Europe. [1]
Bodies of Water
Some of the bodies of water in Russia are the Caspian Sea, which is a sea, and many other major rivers. These include the Amur, the Lena, the Yenisey, and the Volga, which is the most famous river in Russia. [2]
Topographic Features
Some of Russia’s notable geographic features are the hills of Ural and the forests of Siberia. Also, Russia houses Europe’s largest peak: Mount El’brus, which is 5,633 m high. [1]
Bordering Oceans
The bodies of water that border Russia are the Sea of Okhotsk, the Black Sea, the North Pacific Ocean, and the Arctic Ocean.[3]
Climate
Russia has many climate zones, but the zone described below is Moscow, Russia.
Russia's average monthly rainfall is as follows: January- 1.4 inches, February- 1.1 in, March- 1.3 in, April- 1.5 in, May- 2.0 in, June- 2.6 in, July- 3.2 in, August- 2.8 in, September- 2.3 in, October- 2.0 in, November- 1.7 in, December- 1.7 in. [4]
It's monthly temperature range is as follows: (Fahrenheit) January= 10.0- 20.8 degrees; February= 10.9- 23.4 degrees; March= 20.5- 33.6 degrees; April= 34.5- 50.4 degrees; May= 45.3- 64.6 degrees; June= 52.9- 71.4 degrees; July= 56.1- 73.8 degrees; August= 53.6- 70.7 degrees; September= 44.8- 59.9 degrees; October= 35.8- 46.4 degrees; November= 25.3- 33.3 degrees; December= 16.7- 25.7 degrees. [5]
Koppen Classification Code (for Irkutsk, Russia)= Dwc [6]
There are many things that affect Russia's climate. Some of these are latitude, location, terrain, elevation and proximity to water. First, the latitude that Russia is located at places it a good distance from the equator. This makes it much colder, due to the fact that the sun shines less on that area than an area closer to the equator. Also, the location of Russia, with the polar ice caps in such close proximity, causes the temperatures to drop significantly. Another factor that affects the climate drastically in Russia is the topography. There are many mountain ranges in Russia, such as the Abakan and Koryak ranges, [7]which causes cold air to flow down the mountain, creating cold weather near the bases of these ranges. The ocean currents do no affect this region since it is not an island or peninsula. Also, the prevailing winds in this region are prevailing northwesterlies, which do not have much of an impact on the climate, because despite the fact that they bring warm wind from the equator, that still does not have much effect on the climate there. Although there are many high and low pressure systems across Russia, these don't have much of an imprint on the weather there. The vegetation in Russia is extremely varied. There are areas of dense forest, which produce oxygen and absorb sunlight, and flat farmlands. There are also the arid tundra plants of areas like Siberia.
Sources
- ↑ 1.0 1.1 1.2 1.3 https://www.cia.gov/library/publications/the-world-factbook/geos/rs.html
- ↑ http://kids.britannica.com/comptons/article-207540/Russia
- ↑ http://novaonline.nvcc.edu/eli/evans/HIS241/Notes/Geography/Geography.html
- ↑ http://www.worldclimate.com/cgi-bin/data.pl?ref=N55E037+2100+27612W
- ↑ http://www.worldclimate.com/cgi-bin/data.pl?ref=N55E037+1204+0048283G2
- ↑ http://en.wikipedia.org/wiki/Köppen_climate_classification
- ↑ http://en.wikipedia.org/wiki/Category:Mountain_ranges_of_Russia
https://www.cia.gov/library/publications/the-world-factbook/geos/rs.html http://kids.britannica.com/comptons/article-207540/Russia http://novaonline.nvcc.edu/eli/evans/HIS241/Notes/Geography/Geography.html
Japan
Bodies of Water
Japan has many bays, but the most prominent is Tokyo Bay. There are also many bodies of water in Japan such as the Shinano, Tokachi and Mogami Rivers, Lake Kasumiguara and Lake Biwa. [1]
Location
Japan is located at 36 00 N, 138 00 E, between the Pacific Ocean and the continent of Asia. [2]
Geography
Japan is a hilly and mountainous country, and it suffers from many volcanic eruptions. It recently was struck by a horrific earthquake. [2]
Elevation Extremes
The highest point in Japan is Fujiyama, which is at 3,776 meters above sea level. The lowest point is Hachiro-gata at -4 meters below sea level. [2]
Topographic Features
Japan is situated in an area that makes it extremely vulnerable to volcanic eruptions and earthquakes. Japan is an archipelago, which is a string of islands, and many of those islands are volcanic, including Iwo Jima. [3]
Bordering Oceans
Japan borders the North Pacific Ocean and the Sea of Japan. [2]
Climate
The region described below is Tokyo, Japan.
The Koppen Classification System code for Japan is Cfa. [4]
The average temperature range in Tokyo, Japan is as follows (Fahrenheit) January= 33.8-48.0 degrees; February= 35.2-48.6 degrees; March= 40.1-54.1 degrees; April= 49.6-64.0 degrees; May= 57.7-71.4 degrees; June= 64.4-76.8 degrees; July= 72.1-83.7 degrees; August= 74.5-86.7 degrees; September= 68.4-79.5 degrees; October= 57.4-69.6 degrees; November= 47.5-61.0 degrees; December= 38.7-52.5 degrees. [5][6]
The average monthly rainfall in Tokyo, Japan is as follows (inches) January= 2.0 in; February= 2.8 in; March= 4.2 in; April= 5.1 in; May= 5.7 in; June= 6.9 in; July= 5.3 in; August= 5.8 in; September= 8.5 in; October= 7.6 in; November= 3.8 in; December= 2.1 in. [7]
There are many factors that factor into Japan's climate. Some of these are location, proximity to water, topography and elevation. First off, the location of Japan makes it extremely vulnerable to natural disasters, as seen in the 2010 Japan earthquake. Also, there have been two recent earthquakes in Japan, both occurring within the last year. Japan's location also contributes to it's warm and humid climate. [8] It is much closer to the equator than much of the rest of Asia, and therefore receives more sunlight, allowing the ground and air in Japan to be warmer. Moreover, the proximity to water most definitely has an impact on Japan's climate. It is in the middle of the Pacific Ocean, which is a relatively warm body of water. This allows the warm air over the ocean to blow inland to Japan and warm it. Also, the most significant factors of influence on Japan's climate are the major oceanic currents that flow past it. THe two most notable of these are the Kuroshio Current and the Oyashio Current. The Kuroshio Current brings warm water northward over the Pacific side of Japan, and warms areas all along the coast, including areas as far north as Tokyo. The Oyashio Current is a cold current which brings abundant amounts of plankton to fish living near and around Japan. This is why where the two currents meet, at 36 degrees North latitude, is such a rich and bountiful fishing ground. Another factor that contributes to Japan's climate is it's high and low pressure zones. In the summertime, there is a high pressure system over the continent of Asia. This causes wind to flow over the warm Sea of Japan and bring that warm moist air to the mainland. In the winter, the prevailing winds bring cool air from the Northwest, which is why Japan is cooler in the wintertime. [9] Japan's elevation is relatively low due to the fact that it is an island; most of it's landmass is around 1,00 ft. above sea level. This allows for warm air to come directly in from the sea and warm the country. [10] Japan is relatively hilly and mountainous, which allows for the frequent occurrence of valley and mountain local winds. And finally, the vegetation of Japan does not have a major effect on it's climate, but some of the very famous plants in Japan are the cherry trees, the Take, or bamboo, and the Matsu, which means pine. [11]
Sources
http://www.wepa-db.net/policies/state/japan/japan.htm https://www.cia.gov/library/publications/the-world-factbook/geos/ja.html http://www.koreanhistoryproject.org/Jta/Jp/JpGEO1.htm
India
Climate
Averages
| Dehli Temperature | Jan | Feb | Mar | Apr | May | Jun | Jul | Aug | Sep | Oct | Nov | Dec | ||
| Avg. Temperature | 55 | 61 | 72 | 83 | 91 | 90 | 87 | 85 | 84 | 77 | 66 | 57 | ||
| Avg. Max Temperature | 68 | 74 | 85 | 97 | 103 | 100 | 94 | 92 | 93 | 90 | 82 | 72 | ||
| Avg. Max Temperature | 68 | 74 | 85 | 97 | 103 | 100 | 94 | 92 | 93 | 90 | 82 | 72 | ||
| Avg. Min Temperature | 45 | 50 | 59 | 69 | 78 | 81 | 81 | 79 | 76 | 66 | 54 | 46 | ||
| Avg. Rain Days | 1 | 2 | 2 | 2 | 3 | 5 | 8 | 8 | 3 | 1 | 0 | 0 | ||
| Avg. Snow Days | 0 | 0 | 0 | 0 | 0 | 0 | 0 | 0 | 0 | 0 | 0 | 0 |
| Springar Temperature | Jan | Feb | Mar | Apr | May | Jun | Jul | Aug | Sep | Oct | Nov | Dec | ||
| Avg. Temperature | 34 | 40 | 48 | 57 | 65 | 72 | 76 | 74 | 68 | 56 | 45 | 37 | ||
| Avg. Max Temperature | 43 | 49 | 59 | 69 | 77 | 84 | 86 | 85 | 82 | 72 | 60 | 48 | ||
| Avg. Min Temperature | 27 | 32 | 39 | 45 | 52 | 59 | 66 | 64 | 55 | 43 | 34 | 29 | ||
| Avg. Rain Days | 1 | 4 | 5 | 6 | 5 | 5 | 4 | 4 | 2 | 3 | 1 | 2 | ||
| Avg. Snow Days | 3 | 1 | 0 | 0 | 0 | 0 | 0 | 0 | 0 | 0 | 0 | 0 |
| Bombay Temperature | Jan | Feb | Mar | Apr | May | Jun | Jul | Aug | Sep | Oct | Nov | Dec | ||
| Avg. Temperature | 75 | 77 | 81 | 83 | 85 | 84 | 82 | 82 | 82 | 83 | 81 | 77 | ||
| Avg. Max Temperature | 87 | 88 | 91 | 91 | 92 | 90 | 86 | 87 | 88 | 92 | 93 | 90 | ||
| Avg. Min Temperature | 62 | 64 | 69 | 75 | 79 | 79 | 77 | 77 | 76 | 74 | 69 | 64 | ||
| Avg. Rain Days | 0 | 0 | 0 | 0 | 2 | 13 | 18 | 18 | 11 | 4 | 0 | 0 | ||
| Avg. Snow Days | 0 | 0 | 0 | 0 | 0 | 0 | 0 | 0 | 0 | 0 | 0 | 0 |
| Bangalore Temperature | Jan | Feb | Mar | Apr | May | Jun | Jul | Aug | Sep | Oct | Nov | Dec | ||
| Avg. Temperature | 70 | 74 | 79 | 80 | 79 | 75 | 73 | 73 | 74 | 73 | 71 | 69 | ||
| Avg. Max Temperature | 82 | 87 | 91 | 92 | 91 | 85 | 82 | 82 | 83 | 82 | 81 | 79 | ||
| Avg. Min Temperature | 61 | 64 | 67 | 70 | 70 | 68 | 68 | 67 | 67 | 67 | 64 | 61 | ||
| Avg. Rain Days | 0 | 1 | 0 | 4 | 6 | 7 | 11 | 11 | 9 | 9 | 4 | 2 | ||
| Avg. Snow Days | 0 | 0 | 0 | 0 | 0 | 0 | 0 | 0 | 0 | 0 | 0 | 0 |
| Hyderbad Temperature | Jan | Feb | Mar | Apr | May | Jun | Jul | Aug | Sep | Oct | Nov | Dec | ||
| Avg. Temperature | 72 | 77 | 84 | 88 | 90 | 84 | 79 | 78 | 78 | 77 | 75 | 71 | ||
| Avg. Max Temperature | 84 | 90 | 97 | 100 | 102 | 94 | 88 | 86 | 87 | 87 | 85 | 83 | ||
| Avg. Min Temperature | 60 | 65 | 70 | 75 | 78 | 75 | 72 | 71 | 71 | 69 | 64 | 58 | ||
| Avg. Rain Days | 1 | 0 | 1 | 3 | 5 | 11 | 15 | 15 | 9 | 7 | 2 | 0 | ||
| Avg. Snow Days | 0 | 0 | 0 | 0 | 0 | 0 | 0 | 0 | 0 | 0 | 0 | 0 |
| Imphal Temperature | Jan | Feb | Mar | Apr | May | Jun | Jul | Aug | Sep | Oct | Nov | Dec | ||
| Avg. Temperature | 57 | 62 | 69 | 74 | 76 | 77 | 77 | 77 | 76 | 72 | 66 | 59 | ||
| Avg. Max Temperature | 72 | 75 | 80 | 85 | 85 | 85 | 84 | 84 | 84 | 83 | 79 | 73 | ||
| Avg. Min Temperature | 41 | 46 | 54 | 63 | 67 | 71 | 72 | 71 | 70 | 63 | 55 | 44 | ||
| Avg. Rain Days | 1 | 2 | 2 | 2 | 5 | 7 | 9 | 8 | 8 | 4 | 1 | 0 | ||
| Avg. Snow Days | 0 | 0 | 0 | 0 | 0 | 0 | 0 | 0 | 0 | 0 | 0 | 0 |
Koppen Scale
India has about nine different regions according to the Koppen Climate Scale. The different Regions are the Warm Semi-Arid (BWh), the Tropical Savanna (AW), the Temperate Contenental (Dfb), the Warm Desert (BWh), the Humid Subtropical (CWa) the Highland Subtropical (CWb)and the Warm Mediterranean (CSa).

Latitude

Because India is at about 10 to about 35 degrees north, It is usually warm because it is at the equator. The ground and the nearby ocean warms up to cause hot humid temperatures in the lower parts of India.
 \
\
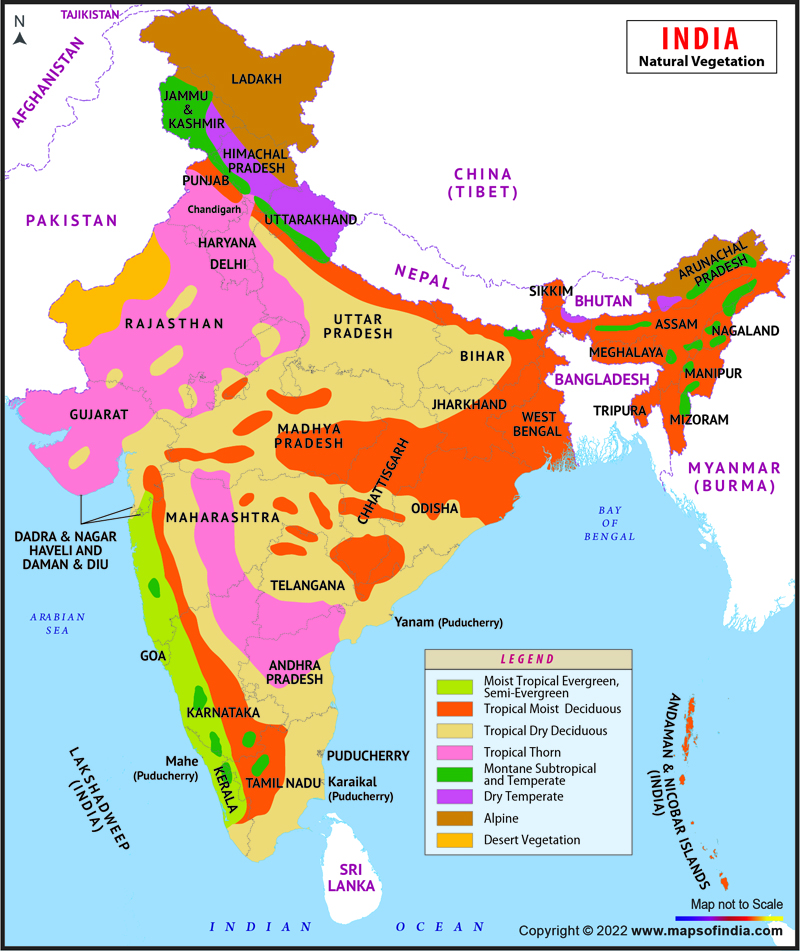
Vegitation
 In northern India by the Himalayas, the vegetation is Alpine, in the
mainland of India ther is the Tropical Dry Decidous and Tropical Decidous Moist, in the north west of India there is the Tropical Thorn, and in the South West there is the Moist tropical Evergreen/Semi-Evergreen and Wet temperate, and near the Alpine there is also the Dry Temperate with Grasslands
In northern India by the Himalayas, the vegetation is Alpine, in the
mainland of India ther is the Tropical Dry Decidous and Tropical Decidous Moist, in the north west of India there is the Tropical Thorn, and in the South West there is the Moist tropical Evergreen/Semi-Evergreen and Wet temperate, and near the Alpine there is also the Dry Temperate with Grasslands
 Cite error: Closing
 </ref> missing for <ref> tag
. 
Proximity to water
Because India Is next to the India Equatorial Countercurrent the southern part of India is warm. The warm current brings in moisture for the summer monsoons.
Prevailing winds
The global winds in India Change depending on what season it it is. In the summer the
Bodies of Water
Large bodies that border India are the Arabian Sea, the Bay of Bengals, and the Indian Ocean.
Latitude and Longitude
""The Coordinates are 20N, 77E."".
Elevation Range
""The lowest point is the Indian Ocean at 0 m
The highest point is Kanchenjunga at 8,598 m""
Topographical features
In the north of India the largest mountain range in the world exists, the Himalayan Mountain Range. In the south of India there are deserts. In the west there are rolling plains.
India Lies between China, Burma, Nepal, Bhutan and Pakistan.

Philippines
Climate
Koppen Scale
The Philippines has manly two regions, the Tropical wet(Af) and Tropical monsoonal (am)

Averages in Manila
| Manila Temperature | Jan | Feb | Mar | Apr | May | Jun | Jul | Aug | Sep | Oct | Nov | Dec | ||
| Avg. Temperature | 80 | 81 | 83 | 86 | 85 | 84 | 82 | 83 | 82 | 83 | 82 | 80 | ||
| Avg. Max Temperature | 85 | 87 | 89 | 92 | 91 | 90 | 87 | 88 | 87 | 88 | 87 | 85 | ||
| Avg. Min Temperature | 75 | 76 | 77 | 80 | 80 | 79 | 78 | 78 | 78 | 78 | 77 | 75 | ||
| Avg. Rain Days | 3 | 2 | 2 | 2 | 5 | 8 | 13 | 13 | 17 | 6 | 6 | 5 | ||
| Avg. Snow Days | 0 | 0 | 0 | 0 | 0 | 0 | 0 | 0 | 0 | 0 | 0 | 0 |
Averages in Puerto Princesa AFB
| Puerto Princesa AFB Temperature | Jan | Feb | Mar | Apr | May | Jun | Jul | Aug | Sep | Oct | Nov | Dec | ||
| Avg. Temperature | 80 | 80 | 81 | 83 | 82 | 81 | 81 | 80 | 81 | 81 | 81 | 80 | ||
| Avg. Max Temperature | 87 | 87 | 88 | 90 | 90 | 89 | 88 | 88 | 88 | 88 | 88 | 86 | ||
| Avg. Min Temperature | 74 | 74 | 75 | 76 | 76 | 75 | 75 | 75 | 75 | 75 | 75 | 74 | ||
| Avg. Rain Days | 3 | 2 | 3 | 4 | 6 | 8 | 10 | 9 | 8 | 9 | 8 | 5 | ||
| Avg. Snow Days | 0 | 0 | 0 | 0 | 0 | 0 | 0 | 0 | 0 | 0 | 0 | 0 |
Averages in Legapazi
| Legapazi Temperature | Jan | Feb | Mar | Apr | May | Jun | Jul | Aug | Sep | Oct | Nov | Dec | ||
| Avg. Temperature | 78 | 78 | 80 | 82 | 83 | 83 | 81 | 82 | 81 | 81 | 80 | 79 | ||
| Avg. Max Temperature | 83 | 84 | 86 | 88 | 90 | 89 | 88 | 88 | 88 | 88 | 86 | 84 | ||
| Avg. Min Temperature | 73 | 73 | 75 | 76 | 77 | 77 | 76 | 76 | 76 | 75 | 75 | 74 | ||
Latitude
.svg/250px-The_Philippines_and_ASEAN_(orthographic_projection).svg.png) The Philippines is between 7 degrees and 15 degrees. It is very close to the equator so the winds are the Easterly trade winds. This affects the climate by moderating the temperature.
The Philippines is between 7 degrees and 15 degrees. It is very close to the equator so the winds are the Easterly trade winds. This affects the climate by moderating the temperature.
Elevation and Vegitation
The elevation varies slightly it ranges from over 500 meters above sea level and below one hundred meters above sea level and ther is lots of rainforests that grow in those areas.

Topography to high and low pressure zones
It is a low pressure zone because the air is sinking at that latitude.
Proximety to Currents
The currents bring warm water into the Philippines. This water can cause severe rain and typhoons such as tropical storm Banyan which killed 9 people.

Bodies of Water
The Philippines consists of grouped islands in the Indian Ocean. [[1]]
![[1]](http://1.bp.blogspot.com/-BbxlExwUfTY/TcQLm6u3uII/AAAAAAAAAQk/_I7ylxuMG3c/s1600/philippines-map.jpg)
Elevation Range
The lowest point is the Philippine Sea 0 m The highest point is Mount Apo 2,954 m
Latitude and Longitude
13 00 N, 122 00 E
Topographical features
It is an archipelago and it is on a fault line
China
The Zhonghua Renmin Gongheguo (People’s Republic of China), is located in Eastern Asia, bordering the East China Sea, Korea Bay, Yellow Sea, and South China Sea, between North Korea and Vietnam. At 35’00” N, 105’00” E, China contains Template:H:title in total; Template:H:title of land and Template:H:title of water. Slightly smaller than the US, China has the largest population of any country in the world, boasting over 1.3 billion citizens. The total population is 1,336,718,015, largest compared to other countries in the world. The country’s most populous cities are Shanghai at 16.575 million, Beijing at 12.214 million, Chongqing at 9.401 million, Shenzhen at 9.005 million, and Guangzhou at 8.884 million. [17]
Geography
China is the world’s fourth largest country in total land and water, after Russia, Canada, and the US. It borders Afghanistan, Bhutan, Burma, India, Kazakhstan, North Korea, Kyrgyzstan, Laos, Mongolia, Nepal, Pakistan, Russia, Tajikistan, and Vietnam for a total of Template:H:title. Its coastline is Template:H:title km long and claims Template:H:title of territorial sea, Template:H:title of shared sea, and Template:H:title of exclusive economic zone. Mt. Everest, on the border with Nepal, is the world’s tallest peak.
Several large bodies of water surround China. They are the South China Sea, Yellow Sea, Sea of Japan, and the Pacific Ocean.[18] China is next to the Kuroshio Ocean Current, the North Equatorial Current, South Equatorial Ocean Current, and the Taiwan Warm Current. [19]They bring in warm/cold, moist air into the region and supply the water needed for many typed of plants and animals. The Yangtze and Yellow Rivers are the third- and sixth- longest in the world and are home to a variety of species of plant and animal life. In relation to the Koppen Classification System, China is Af, Am, and Aw near the Himilayas. Near the more equatorial areas, China is Cwa, Cwb, Cwc, Cfa, Cfb, and Cfc. Much of China is BWk and BSk. The Eastern coasts of China are near the Northeasterly Trade Winds, which bring about many typhoons. Thick bamboo forests originally covered much of China and created rainforest-like climates, but recent foresting for use of chopsticks and other assortments have negatively affected China’s forests and climates, as well as the population of native plants and animals such as the panda.
Climate
The Climate of China is extremely diverse, because of the fact that it is quite tropical in southern China from the river-valley areas near the Yangtze River, Yellow River, and others, but subarctic in the north from the Himalayas. The lowest point in China is Turpan Pendi at Template:H:title below sea level, and Mt. Everest claims its highest point at Template:H:title above sea level and counting. [20]The temperature varies from around Template:H:title to about Template:H:title, from the Himalayas to the Wuhan, Chongqing, and Nanjing Rivers, along with the Yangtze and Yellow Rivers.[21]
Natural Disasters
China is prone to frequent typhoons (about 5 per year along the southern and eastern coasts), damaging floods, tsunamis, earthquakes, droughts, land subsidence, and volcanism, though most haven’t been active for more than a century. They include Changbaisha, Hainan Dao, and Kunlun. Changbaisha, a.k.a. Baitoushan, Baegdu, or P’aektu-san, is home to Heaven Lake, a caldera left behind by a major eruption in 969 AD, ± 20 years that filled up with rainwater. Among the stranger findings are sinkholes. Often referred to as “tiankeng” or skyholes, sinkholes have appeared throughout the world, most recently in China. In one instance, sinking land has created an enormous hole in front of an elementary school and swallowed an entire playground in Ningxiang county in China's Hunan province, the Associated Press reports. The sinkhole started to yield in mid-January, at first forming a hole twenty meters in diameter. Intense springtime rainfall has since accelerated the hole's expansion, which has, in turn, caused damage to area buildings.[22]
Natural Resources
China contains an abundance of natural resources, including coal, iron ore, petroleum, natural gas, mercury, tin, tungsten, antimony, manganese, molybdenum, vanadium, magnetite, aluminum, lead, zinc, rare earth elements, uranium, and has the world’s largest hydropower potential.
China’s exports of raw products/material include electrical and other machinery, including data processing equipment, apparel, textiles, iron and steel, and optical and medical equipment.
It imports electrical and other machinery, oil and mineral fuels, optical and medical equipment, metal ores, plastics, and organic chemicals.
China is a world leader in gross value of agricultural output − rice, wheat, potatoes, corn, peanuts, tea, millet, barley, apples, cotton, oilseed, pork, and fish.
Also, it is the world leader in gross value of industrial output – mining and ore processing, iron, steel, aluminum and other metals, coal, machine building, armaments, textiles and apparel, petroleum, cement, chemicals, fertilizers, consumer products such as footwear, toys and electronics, food processing, transportation equipment including automobiles, rail cars and locomotives, ships, and aircraft, telecommunications equipment, commercial space launch vehicles, and satellites.
14.86% of the land in China is farmable, 1.27% of it is used for permanent farming, and 83.87% of the land is used to build and expand suburban communities, cities, and such. Template:H:title of land in China is irrigated, and 2,829.6 cu km of water is renewable. [23]
Biodiversity
In China, the regional area of the mountains in the southwest, by far, contains the most types of species, in both plants and animals. China has a wealth of biodiversity, with the largest amount of bird species and gymnosperm variation in the world, but it faces a grave situation: in just the southwest mountains, 15-20% of higher plant varieties are endangered, pressuring the existence of the 40.00 species of organisms related with them. But China has good news: since 1500 CE, no recorded species have ever gone extinct in that area. The Mountains of Southwest China, with Template:H:title of protected land and Template:H:title of higher leveled protection of land, has taken part in an ongoing effort, like all countries, to preserve biodiversity, stop climate change, and keep the environment clean. The number of endangered plant species and frightening, with about 3,500 species endangered. In late 2010, China revealed an aggressive plan to protect biodiversity. The plan was to divide 23% of the country into 35 priority conservation areas and to set a target of controlling biodiversity loss by 2020. Although helpful, this is too late, considering that already, the panda, the snow leopard, and the red panda are critically endangered. [24]
Environment
China’s air quality is at fault, as it contributes to smog and acid rain. Air pollution (greenhouse gases, sulfur dioxide particulates) from reliance on coal produces the acid rain. China also suffers from the occasional water shortage, particularly in the north; water pollution from untreated wastes; deforestation; and an estimated loss of one-fifth of agricultural land since 1949 to soil erosion and economic development; desertification; and trade in endangered species. [25]
Global Environmental Treatises
China is a party of the Antarctic-Environmental Protocol, Antarctic Treaty, Climate Change-Kyoto Protocol, Biodiversity, Law of the Sea, Tropical Timber 83, Tropical Timber 94, and Ozone Layer Protection, and attempts to preserve Wetlands, and Endangered Species. It acts to prevent Marine Dumping, Climate Change, Desertification, Environmental Modification, Hazardous Wastes, Ship Pollution, and Whaling. [26]
Energy
Electricity
- Production
- 3.446 trillion kWh (2nd country in world)
- Consumption
- 3.438 trillion kWh (2nd country in world)
- Exports
- 17.39 billion kWh
- Imports
- 11.38 billion kWh
Oil
- Production
- 4.273 million bbl/day (4th country in the world)
- Consumption
- 9.189 million bbl/day (3rd country in the world)
- Exports
- 480,600 bbl/day (30th country in the world)
- Imports
- 4.753 million bbl/day (3rd country in the world)
- Proved Reserves
- 20.35 billion bbl\day (14th country in the world)
Natural Gas
- Production
- 94.41 billion cu m (8th country in the world)
- Consumption
- 106.7 billion cu m (5th country in the world)
- Exports
- 4.02 billion cu m (29th country in the world)
- Imports
- 16.33 billion cu m (17rd country in the world)
- Proved Reserves
- 3.03 trillion cu m (13th country in the world) [27]
- ↑ http://www.wepa-db.net/policies/state/japan/japan.htm
- ↑ 2.0 2.1 2.2 2.3 https://www.cia.gov/library/publications/the-world-factbook/geos/rs.html
- ↑ http://www.koreanhistoryproject.org/Jta/Jp/JpGEO1.htm
- ↑ http://en.wikipedia.org/wiki/Köppen_climate_classification
- ↑ http://www.worldclimate.com/cgi-bin/data.pl?ref=N35E139+1200+0048130G2
- ↑ http://www.worldclimate.com/cgi-bin/data.pl?ref=N35E139+1204+0052049G2
- ↑ http://www.worldclimate.com/cgi-bin/data.pl?ref=N35E139+2100+47662W
- ↑ http://www.japaneselifestyle.com.au/japan/japan_climate.htm
- ↑ http://therearenosunglasses.wordpress.com/2011/03/13/41732/
- ↑ http://en.wikipedia.org/wiki/Geography_of_Japan
- ↑ http://www.japan-guide.com/e/e2122.html
- ↑ http://www.climate-zone.com/climate/india/
- ↑ https://www.cia.gov/library/publications/the-world-factbook/geos/in.html
- ↑ http://geography.about.com/library/weekly/aa011700b.htm
- ↑ http://www.climate-zone.com/climate/philippines/
- ↑
- ↑ https://www.cia.gov/library/publications/the-world-factbook/geos/ch.html CIA Factbook
- ↑ Google Earth
- ↑ http://www.worldclimate.com/ World Climate Map
- ↑ http://climate-charts.com/World-Climate-Index-Map.html World Climate Map
- ↑ http://climate-charts.com/World-Climate-Maps.html World Climate Map (2)
- ↑ https://www.cia.gov/library/publications/the-world-factbook/geos/ch.html CIA Factbook
- ↑ https://www.cia.gov/library/publications/the-world-factbook/geos/ch.html CIA Factbook
- ↑ http://www.britannica.com/EBchecked/topic/111803/China Britannica Encyclopedia
- ↑ https://www.cia.gov/library/publications/the-world-factbook/geos/ch.html CIA Factbook
- ↑ https://www.cia.gov/library/publications/the-world-factbook/geos/ch.html CIA Factbook
- ↑ https://www.cia.gov/library/publications/the-world-factbook/geos/ch.html CIA Factbook