Difference between revisions of "Earth Science 7 North America 5"
| Line 1: | Line 1: | ||
[[Earth Science 7-Regions]] | [[Earth Science 7-Regions]] | ||
| − | '''North America''' | + | ='''North America'''= |
On this page, we will be showing you the major weather/geographical events of Canada, Mexico, and the United States of America. | On this page, we will be showing you the major weather/geographical events of Canada, Mexico, and the United States of America. | ||
Revision as of 12:39, 22 February 2012
Contents
- 1 North America
- 2 Rock Types in North America
- 3 United States of America
- 3.1 Latitude and Longitude
- 3.2 Elevation Range
- 3.3 Highest Point
- 3.4 Lowest Point
- 3.5 Large Bodies of Water
- 3.6 Major Rivers
- 3.7 Major Topographic Features
- 3.8 Bordering Oceans
- 3.9 Average Monthly High/Low (Temperature in Celsius)
- 3.10 Average Monthly Rainfall (in mm)
- 3.11 Average Monthly Precipitation (in mm)
- 3.12 Climate Zone (Koppen Classification System)- Bsk and Cfa
- 3.13 Effects on the Climate
- 3.14 Minerals in the United States
- 4 Mexico
- 4.1 Latitude and Longitude
- 4.2 Elevation Range
- 4.3 Highest Point
- 4.4 Lowest Point
- 4.5 Largest Bodies of Water
- 4.6 Major Rivers
- 4.7 Major Topographic Features
- 4.8 Bordering Oceans
- 4.9 Average Monthly High/Low (Temperature Celsius)
- 4.10 Average Monthly Rainfall
- 4.11 Average Monthly Precipitation
- 4.12 Climate
- 4.13 Climate Zone (Koppen Classification System)
- 4.14 Effects on the Climate
- 5 Canada
- 5.1 Latitude and Longitude
- 5.2 Elevation Range
- 5.3 Highest Point
- 5.4 Lowest Point
- 5.5 Large Bodies of Water
- 5.6 Major Rivers
- 5.7 Major Topographic Features
- 5.8 Bordering Oceans
- 5.9 Average Monthly High/Low (Temperature)
- 5.10 Average Monthly Rainfall
- 5.11 Average Monthly Precipitation
- 5.12 Climate Zone (Koppen Classification System)
- 5.13 Effects on the Climate
- 6 Citations
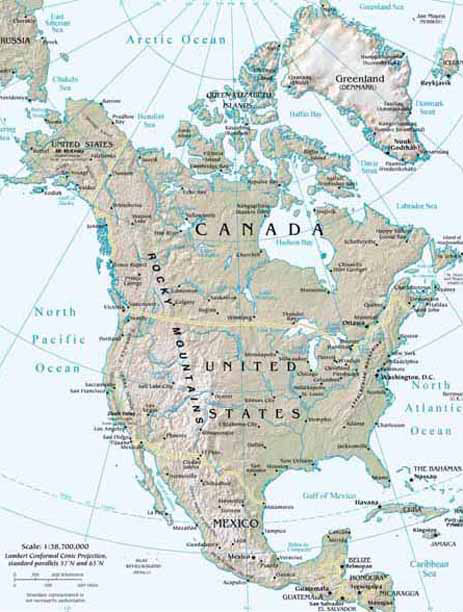
North America
On this page, we will be showing you the major weather/geographical events of Canada, Mexico, and the United States of America.
Rock Types in North America

United States of America
Latitude and Longitude
Atlanta, GA: 33° 74´ N, 84° 38´ W Chicago, IL: 41° 87´ N, 87° 62´ W Miami, FL: 25° 78´ N, 80° 22´ W Washington, DC: (capital city) 38° 89´ N, 77° 03´ W [2]
Elevation Range
20,320 ft. (6,194 m) to (-282 ft.) (-86 m) [3]
Highest Point
Mt. McKinley, (Alaska) 20,320 ft. (6,194 m). [3]
Lowest Point
Death Valley, (California) (-282 ft.) (-86 m) [3]
Large Bodies of Water
Great Salt Lake, Utah, and Lake Okeechobee, Florida.
Major Rivers
 [4]
Some major rivers are: Brazos, Churchill, Colorado, Columbia, Fraser, Mackenzie, Mississippi, Missouri, Ohio, Rio Grande, St. Lawrence, and Yukon
[4]
Some major rivers are: Brazos, Churchill, Colorado, Columbia, Fraser, Mackenzie, Mississippi, Missouri, Ohio, Rio Grande, St. Lawrence, and Yukon
Major Topographic Features
Significant Appalachian ranges: -The Cumberland Mts. in TN -The Blue Ridge Mts. in VA -The Alleghenies in PA -The Catskills Mts. in NY -The Green Mts. in VT -The White Mts. of NH
Significant Rocky Mountain ranges include: Absaroka, Bear River, Beaverhead, Big Belt, Big Horn, Bitterroots, Canadian, Clearwater, Columbia, Front, Guadalupe, Laramie, Lamhl, Lewis, Lost River, Medicine Bow, Monashee, Owyhee, Purcell, Sacramento, Salmon River, San Andres, Sangre de Cristo, Sawatch, Shoshone, Steens, Stillwater, Swan, Tetons, Unita, Wallowa, Wasatch, Wind River, Wyoming, Zuni
Bordering Oceans
Atlantic Ocean, Pacific Ocean
Average Monthly High/Low (Temperature in Celsius)
(In Houston Intercontinental Airport, Harris County, Texas USA)
January High: 16.1 degrees Celsius January Low: 4.2 degrees Celsius [5]
Average Monthly Rainfall (in mm)
(In same place)
January: 98.1 mm. [5]
Average Monthly Precipitation (in mm)
(in same place)
January: 83.5 mm. [5]
Climate Zone (Koppen Classification System)- Bsk and Cfa

A - Tropical Climates Tropical moist climates extend north and south from the equator to about 15° to 25° latitude. In these climates all months have average temperatures greater than 64°F (18°C) and annual precipitation greater than 59".
B - Dry Climates The most obvious climatic feature of this climate is that potential evaporation and transpiration exceed precipitation. These climates extend from 20°-35° North and South of the equator and in large continental regions of the mid-latitudes often surrounded by mountains.
C - Moist Subtropical Mid-Latitude Climates This climate generally has warm and humid summers with mild winters. Its extent is from 30°50° of latitude mainly on the eastern and western borders of most continents. During the winter, the main weather feature is the mid-latitude cyclone. Convective thunderstorms dominate summer months.
D - Moist Continental Mid-latitude Climates Moist continental mid-latitude climates have warm to cool summers and cold winters. The location of these climates is poleward of the C climates. The average temperature of the warmest month is greater than 50°F (10°C), while the coldest month is less than -22°F (-30°C). Winters are severe with snowstorms, strong winds, and bitter cold from Continental Polar or Arctic air masses.
H - Highlands Unique climates based on their elevation. Highland climates occur in mountainous terrain where rapid elevation changes cause rapid climatic changes over short distances.

Bsk: Mid-latitude steppe- Mid-latitude dry.
Evaporation exceeds precipitation on average but is less than potential evaporation.
Average temperature is less than 64°F (18°C).
Cfa: Humid subtropical- Mild with no dry season, hot summer. Average temperature of warmest months are over 72°F (22°C). Average temperature of coldest month is under 64°F (18°C). Year around rainfall but highly variable.
Effects on the Climate
Latitude: Temperatures in the northern part of the US are generally colder than the southern part because temperatures are generally colder toward the poles.
Elevation: Temperatures are generally colder at higher elevations so temps. on the West Coast will generally be colder.
Topography: In the mountains, like the Rocky and Appalachian ranges, the topography causes the air to be colder and more humid on the windward side of the mountain than the leeward side of the mountain. The leeward side of the mountain tends to be warmer and drier.
Proximity to Water: The US is surrounded by the Atlantic and Pacific Ocean. The climates on the coast will be more mild than inland because the temperature range of large bodies of water is small.
Prevailing Winds: Prevailing Westerlies move air masses like Maritime and Continental Tropical west to east. The masses create spells of either humid, warm air or hot and dry air.
Vegetation: The vegetation differs from area to area in the US. For example, in the forest areas, the climate tends to be cooler than desert regions because the trees absorb more sunlight and heat causing the ground to not be as hot. The climate in forest areas also tends to be more humid because the trees and vegetation release water vapor through transpiration. [7]
High or Low Pressure Zone: In areas of lows, the climate is warmer and the air is less dense. In areas of highs, the air is colder and denser.
Ocean Currents: The Gulf Stream (a warm ocean current) warms the East Coast. The California stream (cool current) cools the West Coast.
Minerals in the United States
The major minerals in the United States are coal, iron, copper, silver and gold. There is a band of coal mines from North Dakota to upper Florida. [8]
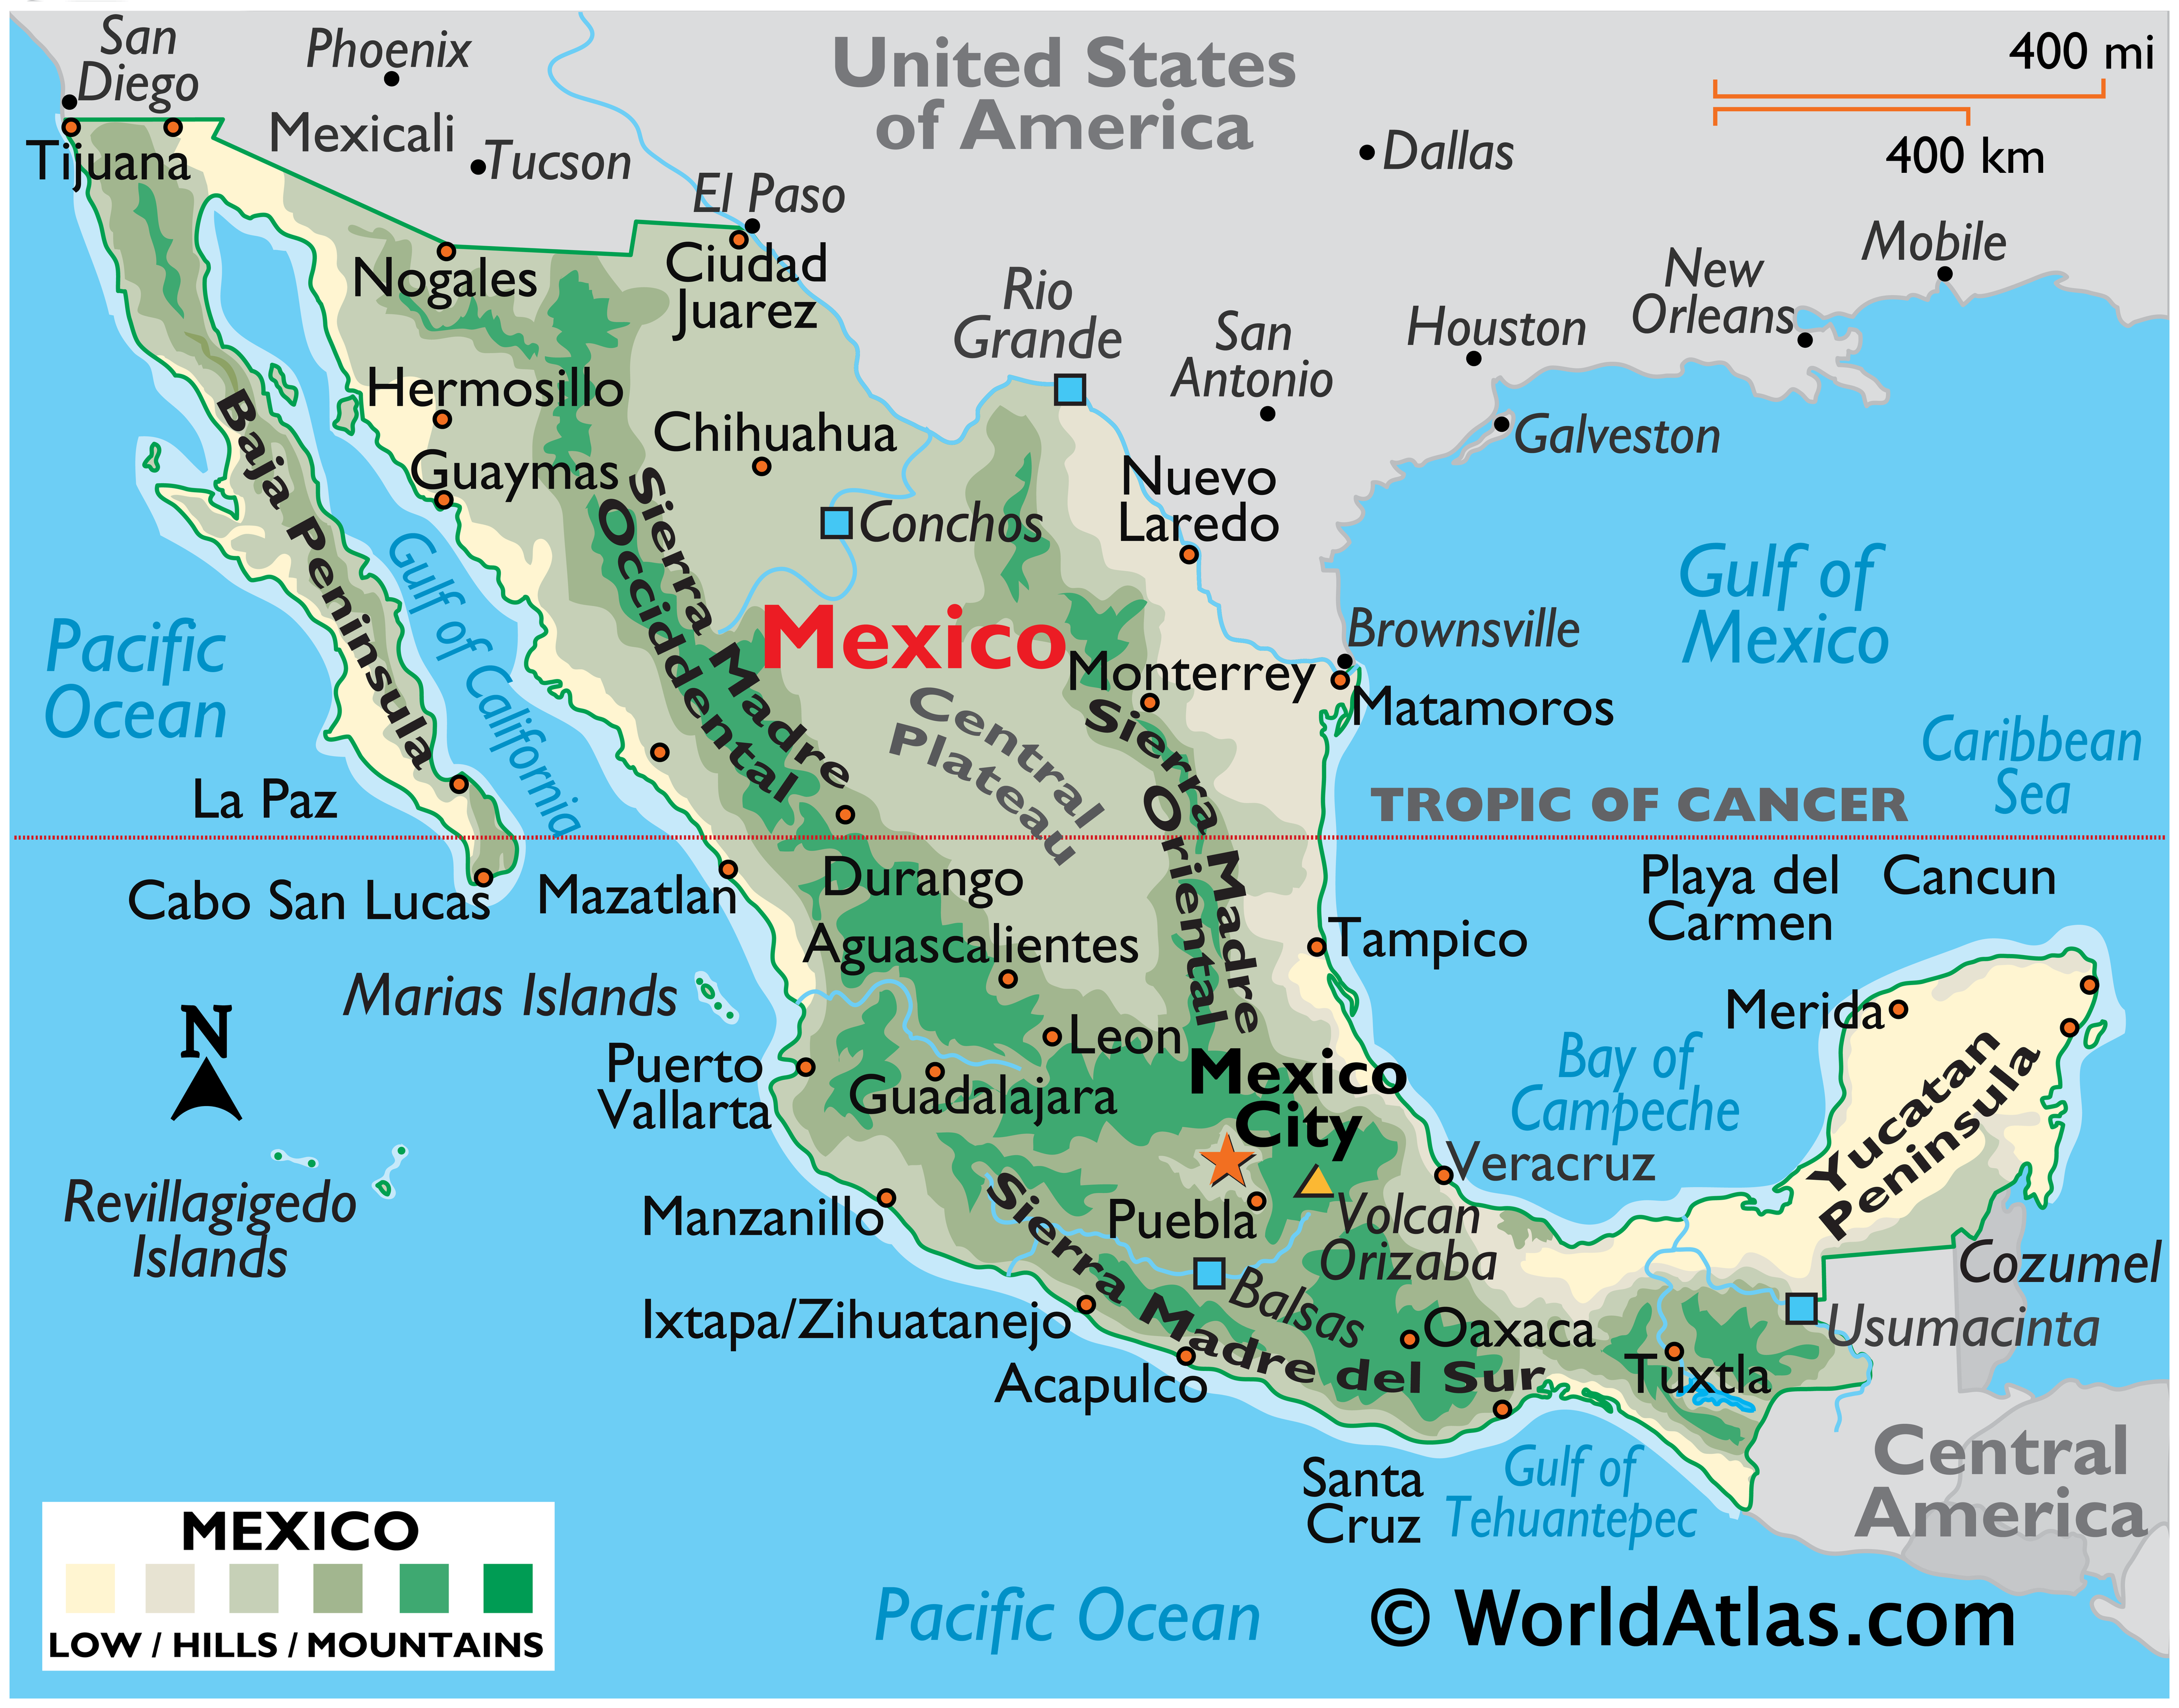
Mexico
Latitude and Longitude
30 N 81 W [3]
Elevation Range
1,500m [4]
Highest Point
Volcan Pico de Orizaba, 5,700 m [5]
Lowest Point
Laguna Salada, -10 m [6]
Largest Bodies of Water
There are no lakes in Mexico but there is the Gulf of Mexico and the Gulf of California.[7]
Major Rivers
Rio Grande, Puebla Conchos, Usumacinta [8]
Major Topographic Features
Sierra Madre Occidental, Gulf Coastal Plain, Central Mexican Plateau, Baja Peninsula [9]
Bordering Oceans
Gulf of Mexico, Pacific Ocean, Caribbean Sea [10]
Average Monthly High/Low (Temperature Celsius)
Low= 13.3[11] High=16.1
Average Monthly Rainfall
634.3 mm [12]
Average Monthly Precipitation
Climate
It is hot and dry in Mexico. Rain occurs on occasions but rarely. [15]
Climate Zone (Koppen Classification System)
BWh: Low-latitude desert. Evaporation exceeds precipitation on average but is less than half potential evaporation. Average temperature is more than 64°F (18°C). Frost is absent or infrequent.[16]
Effects on the Climate
Latitude: Mexico is far away from the poles and close to the equator and ITZC, so the latitude makes it hot and dry.
Elevation: Most of Mexico is at sea level (besides the mountain ranges) so it is very hot.
Topography: There are many mountain ranges in Mexico, so it is colder on the mountains, but the mountains contain less moisture.
Proximity to Water: Mexico is in between two big bodies of water. The temperature range is small near water masses, so it's either hot or not.
Prevailing Winds: Maritime Tropical winds form over the ocean and travel down to Mexico.
Vegetation: Mexico has a lot of deserts which reflect heat and it also heats up and cools down faster.
High/Low Pressure Zone: Mexico has a high pressure zone which makes storms travel away.
Ocean Currents: Warm ocean currents warm nearby coasts.
Canada
Latitude and Longitude
56 7 N / 106 20 W [19]
Elevation Range
5,559 m [20]
Highest Point
Mt. Logan (Yukon), 5,559 m [21]
Lowest Point
Atlantic Ocean, 0 m [22]
Large Bodies of Water
Hudson Bay, Baffin Bay, Labrador Sea, Beaufort Sea, Great Lakes, Great Bear Lake, Great Slave Lake, James Bay, Lake Winnipeg, and Welland Canal [23]
Major Rivers
Ottawa River, Columbia River, St. Lawrence River, Albany River, Nelson River, Saskatchewan River, Athabasca River, Peace River, Liard River, MacKenzie River, Yukon River, and Fraser RIver [24]
Major Topographic Features
Appalachian Mts., Canadian Arctic Archipelago, Canadian Shield, Canada Cordillera, Great Plains, and Rocky Mountains [25] [26]
Bordering Oceans
Atlantic Ocean, Pacific Ocean, Arctic Ocean [27]
Average Monthly High/Low (Temperature)
ET - Dsc - Dfa - Csb - BSk -
Average Monthly Rainfall
ET - Dsc - Dfa - Csb - BSk -
Average Monthly Precipitation
ET - Dsc - Dfa - Csb - BSk -
Climate Zone (Koppen Classification System)
ET - Northern Canada - Tundra - Polar Tundra - no true summer, Dsc - Mid-Northern Canada - Subarctic - cold, dry summer, Dfa - Southeastern Canada - Humid Continental - humid with hot summer, Csb - Western Canada - Mediterranean - mild with cool, hot summer, BSk - Mid-Southern Canada - Mid-lattitude steppe - Mid-lattitude dry [28]
Effects on the Climate
Latitude: Canada is close to the poles and far from the equator causing the temperature to be cold.
Elevation: Canada has high elevation cooling the temperatures.
Topography: Canada contains lots of mountains cooling the temperature and makes more precipitation.
Proximity to Water: The water near Canada is cool, so it cools the land.
Prevailing Winds: Prevailing Westerlies push cool, moist Maritime Polar air masses from west to East across Canada. Also, these Prevailing Westerlies push cold, dry Continental Polar air masses across southern Canada.
Vegetation: Many forests and Tundras in Canada help cool the surface contributing to cooler temperatures.
High/Low Pressure Zone: In the Polar Area of Canada, cold, dense air sinks, causing high pressure at the surface. At 60 degrees latitude in Canada warm air rises causing low pressure at the surface. Also in this area, Polar Fronts occur and it is cold.
Ocean Currents: Cool ocean currents cool nearby coasts.
Citations
http://www.worldatlas.com/webimage/countrys/namerica/us.htm http://www.worldatlas.com/webimage/countrys/namerica/mexico/mxlatlog.htm http://www.worldatlas.com/webimage/countrys/namerica/mx.htm http://www.worldatlas.com/webimage/countrys/namerica/mexico/mxland.htm http://www.worldatlas.com/webimage/countrys/namerica/mexico/mxlandst.htm
http://www.worldatlas.com/aatlas/latitude_and_longitude_finder.htm http://www.worldatlas.com/webimage/countrys/namerica/calandst.htm http://www.worldatlas.com/webimage/countrys/namerica/camaps.htm http://www.worldatlas.com/webimage/countrys/namerica/lgcolor/cacolor.htm http://www.worldatlas.com/webimage/countrys/namerica/caland1.htm http://www.worldatlas.com/webimage/countrys/namerica/caland2.htm http://www.worldatlas.com/webimage/countrys/namerica/calandst.htm http://www.srh.noaa.gov/jetstream/global/climate_max.htm] http://www.classzone.com/books/earth_science/terc/content/investigations/es2101/es2101page02.cfm?chapter_no=investigation] http://www.craigmarlatt.com/canada/geography&maps/maps_vegetation.html]
- ↑ United States. Picture. World Atlas. http://www.worldatlas.com/webimage/countrys/nalnd.htm
- ↑ United States. Website. World Atlas. http://www.worldatlas.com/webimage/countrys/namerica/usstates/uslatlog.htm
- ↑ 3.0 3.1 3.2 United States. Website. World Atlas. http://www.worldatlas.com/webimage/countrys/namerica/usstates/uslandst.htm
- ↑ United States Rivers. Picture. World Atlas. http://www.worldatlas.com/webimage/countrys/namerica/usstates/artwork/rivers/uslayout.htm
- ↑ 5.0 5.1 5.2 Houston. United States. Website. http://www.worldclimate.com/cgi-bin/grid.pl?gr=N29W095
- ↑ United States. Picture. National Weather Service. http://www.srh.noaa.gov/jetstream/global/climate_max.htm
- ↑ United States. Earth Science Textbook. By Nancy E. Spaulding and Samuel N. Namowitz.
- ↑ United States. Website. How Stuff Works. http://maps.howstuffworks.com/world-energy-minerals-map.htm
Created by Maddie Shen, Daniel Perrier, Christina Ru, and Elysa Tulek.