India/Middle East 8
Contents
- 1 India and the Middle East
- 2 Major Seas-Middle East :
- 3 The Latitude and Longitude Regions-Middle East:
- 4 Elevation Range-Middle East
- 5 Large Bodies of Water-Middle East
- 6 Topographic Features-Middle Est
- 7 Bordering Oceans-Middle East
- 8 Major Bodies of Water-India
- 9 Latitude and Longitude Coordinates-India
- 10 Topographic features-India
- 11 Bordering Oceans-India
- 12 Average Monthly Temperature and other climate stuff India
- 13 Average Temperature Middle East
- 14 Average Precipitation Middle East
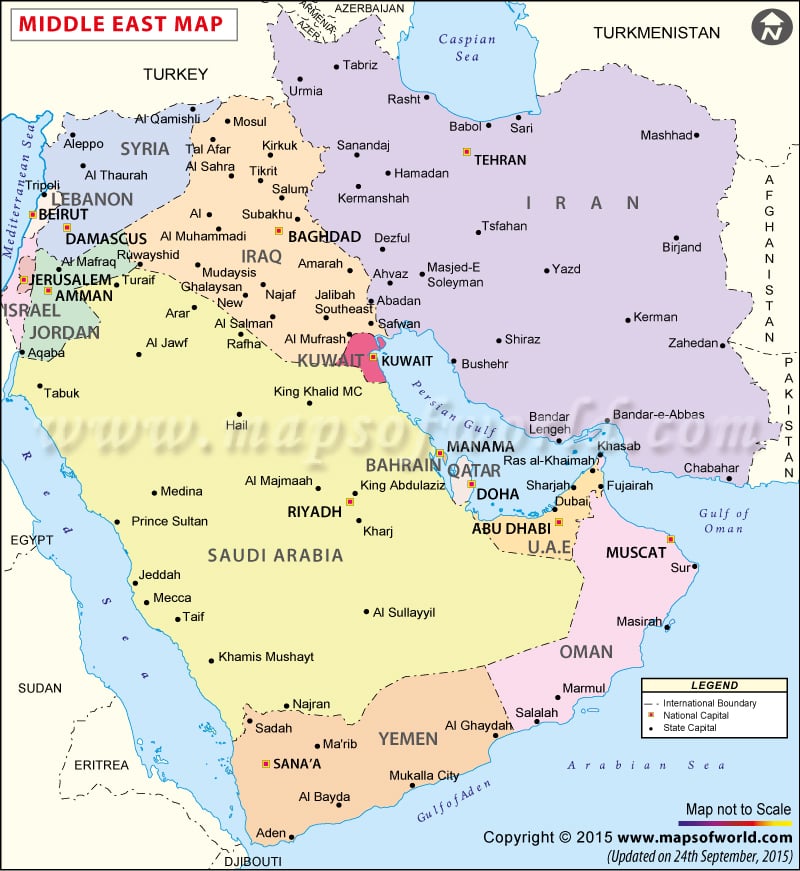
India and the Middle East
Countries-Middle East: Egypt Iran Turkey Sudan Algeria Morocco Iraq Saudi Arabia Yemen Syria Israel Libya Jordan United Arab Emirates Lebanon Palestinian territories Kuwait Oman Qatar Bahrain
Major Seas-Middle East :
Red Sea Gulf of Aqaba Arabian Gulf [1]
The Latitude and Longitude Regions-Middle East:
Latitude: 30 (N) Longitude: 45 (E)
Elevation Range-Middle East
Lowest: The Dead Sea on the boarder of Israel and Jordan in the Middle its height is 1,388 ft below sea level Highest: Pik Samani at 24,590 ft
Large Bodies of Water-Middle East
Dead Sea Mediterranean Sea Black Sea Red Sea Caspian Sea Arabian Sea
Topographic Features-Middle Est
Rub al Khali dessert Caucasus Mts Elbruz Mts Zagros Mts
Bordering Oceans-Middle East
Indian Ocean
Major Bodies of Water-India
Ganges River
Latitude and Longitude Coordinates-India
20 00 N, 77 00 E [2]
Topographic features-India
Deccan Plateau
Bordering Oceans-India
Bay of Bengal Arabian Sea Laccadive Sea [3]
Average Monthly Temperature and other climate stuff India
| New Delhi,India Temperature in Farenheit | Jan | Feb | Mar | Apr | May | Jun | Jul | Aug | Sep | Oct | Nov | Dec | Annual | ||
| Avg. Temperature F | 58 | 63 | 73 | 84 | 91 | 92 | 87 | 86 | 85 | 79 | 69 | 60 | 77 | ||
| Avg. Max Temperature | 68 | 73 | 83 | 95 | 101 | 101 | 93 | 91 | 92 | 90 | 81 | 71 | 87 | ||
| Avg. Min Temperature | 48 | 53 | 62 | 72 | 80 | 83 | 81 | 80 | 78 | 68 | 57 | 49 | 68 | ||
Climate zones: BWh-Hot desert climates BSh-Hot semi-arid climates Cwa-Humid subtropical climate Am-Tropical monsoon climate
The latitude of Delhi, India is 28 35N. The average elevation of India is about 350ft above sea level. The climate zones of India are BWh-Hot desert climates, BSh-Hot semi-arid climates, Cwa-Humid subtropical climate, Am-Tropical monsoon climate. West coasts of continents in tropical and subtropical latitudes (except close to the equator) are bordered by cool waters. Their average temperatures are relatively low with small diurnal and annual ranges. There is fog, but generally the areas (southern California, Mo-rocco, etc.) are arid. West coasts of continents in middle and higher latitudes are bordered by warm waters which cause a distinct marine climate. They are characterized by cool summers and relatively mild winters with a small annual range of temperatures (upper west coasts of the United States and Europe). The average monthly rainfall of the Panta climate zone is 3.267 inches, the average monthly rainfall of the Delhi is 2.308 inches. Here is the topography map. The prevailing winds for Dehli are JAN-4, FEB-4, MAR-5, APR-6, MAY-8, JUN- 6, JUL-6 AUG- 6, SEP-6, OCT- 5, NOV- 3, DEC-4. Most of India is tropical Dry, but some is tropical Thorn. Not many variations in pressure except when the altitude is 6,000ft. The Asiatic Monsoon influences the currents of the North Indian Ocean, while the currents of the South Indian Ocean are influenced by the atmosphere’s anticyclone circulation.
Average Temperature Middle East
| Baghdad, Iraq (BWk) Average Temperature | Jan | Feb | Mar | Apr | May | Jun | Jul | Aug | Sep | Oct | Nov | Dec | Annual |
| Avg. Temperature | 48 | 54 | 62 | 72 | 82 | 90 | 94 | 92 | 86 | 76 | 61 | 52 | 72 |
| Avg. Max Temperature | 58 | 64 | 73 | 84 | 96 | 105 | 110 | 108 | 103 | 91 | 74 | 62 | 86 |
| Avg. Min Temperature | 38 | 43 | 50 | 59 | 68 | 74 | 78 | 75 | 70 | 60 | 47 | 42 | 59 |
| Tehran, Iran (BSk) Average Temperature | Jan | Feb | Mar | Apr | May | Jun | Jul | Aug | Sep | Oct | Nov | Dec | Annual |
| Avg. Temperature | 35 | 41 | 50 | 63 | 71 | 82 | 88 | 85 | 79 | 66 | 53 | 42 | 64 |
| Avg. Max Temperature | 29 | 34 | 42 | 54 | 62 | 72 | 78 | 76 | 70 | 58 | 45 | 36 | 55 |
| Avg. Min Temperature | 29 | 34 | 42 | 54 | 62 | 72 | 78 | 76 | 70 | 58 | 45 | 36 | 55 |
| align="center" style="background:#f0f0f0;"|Tehran, Iran (BSk) Average Temperature | align="center" style="background:#f0f0f0;"|Jan | align="center" style="background:#f0f0f0;"|Feb | align="center" style="background:#f0f0f0;"|Mar | align="center" style="background:#f0f0f0;"|Apr | align="center" style="background:#f0f0f0;"|May | align="center" style="background:#f0f0f0;"|Jun | align="center" style="background:#f0f0f0;"|Jul | align="center" style="background:#f0f0f0;"|Aug | align="center" style="background:#f0f0f0;"|Sep | align="center" style="background:#f0f0f0;"|Oct | align="center" style="background:#f0f0f0;"|Nov | align="center" style="background:#f0f0f0;"|Dec | align="center" style="background:#f0f0f0;"|Annual |- | |- | Avg. Temperature ||35 ||41 ||50 ||63 ||71 ||82 ||88 ||85 ||79 ||66 ||53 ||42 ||64 |- | |- | Avg. Max Temperature ||29 ||34 ||42 ||54 ||62 ||72 ||78 ||76 ||70 ||58 ||45 ||36 ||55 |- | |- | Avg. Min Temperature ||29 ||34 ||42 ||54 ||62 ||72 ||78 ||76 ||70 ||58 ||45 ||36 ||55 |- |
The latitude of Delhi, India is 28 35N. The average elevation of India is about 350ft above sea level. The climate zones of India are BWh-Hot desert climates, BSh-Hot semi-arid climates, Cwa-Humid subtropical climate, Am-Tropical monsoon climate. West coasts of continents in tropical and subtropical latitudes (except close to the equator) are bordered by cool waters. Their average temperatures are relatively low with small diurnal and annual ranges. There is fog, but generally the areas (southern California, Mo-rocco, etc.) are arid. West coasts of continents in middle and higher latitudes are bordered by warm waters which cause a distinct marine climate. They are characterized by cool summers and relatively mild winters with a small annual range of temperatures (upper west coasts of the United States and Europe). The average monthly rainfall of the Panta climate zone is 3.267 inches, the average monthly rainfall of the Delhi is 2.308 inches. Here is the topography map. The prevailing winds for Dehli are JAN-4, FEB-4, MAR-5, APR-6, MAY-8, JUN- 6, JUL-6 AUG- 6, SEP-6, OCT- 5, NOV- 3, DEC-4. Most of India is tropical Dry, but some is tropical Thorn. Not many variations in pressure except when the altitude is 6,000ft. The Asiatic Monsoon influences the currents of the North Indian Ocean, while the currents of the South Indian Ocean are influenced by the atmosphere’s anticyclone circulation.
| Tripoli, Lebanon(Csa) Average Temperature | Jan | Feb | Mar | Apr | May | Jun | Jul | Aug | Sep | Oct | Nov | Dec | Annual |
| Avg. Temperature | 55 | 55 | 57 | 62 | 67 | 74 | 77 | 80 | 76 | 71 | 67 | 59 | 66 |
| Avg. Max Temperature | 61 | 61 | 64 | 69 | 74 | 80 | 83 | 86 | 82 | 79 | 66 | 60 | 73 |
| Avg. Min Temperature | 49 | 49 | 50 | 55 | 61 | 68 | 71 | 74 | 70 | 64 | 59 | 53 | 60 |
Average Precipitation Middle East
Cite error: Closing </ref> missing for <ref> tag
Cite error: <ref> tags exist, but no <references/> tag was found